Business Intelligence
Datakings BI: Transform your data into dynamic insights
Datakings BI transforms your data and presents it in Power BI to dynamic insights. For this we have a number of standard solutions that can be connected to any source. We also help you define the right management information, after which we set up customized dashboards for this, in which, for example, your KPIs are constantly visible.
Working with Datakings BI offers the following benefits:
- Real-time insight into your data: Get instant access to the latest data and trends to quickly respond to changes in your organization.
- Custom Dashboards: Our dashboards are custom-made for you and your organization.
- Standard dashboards: Datakings BI already has a range of standard developed dashboards, to which we only need to connect your data sources.
- Automate processes: Eliminate manual processes and receive up-to-date reports automatically, saving you time and money.
- Deep insights, optimized decisions, increased control: Deep insights give you the tools to make better decisions.
- All possible data sources can be linked: We ensure that data from different sources is integrated for a complete picture of your company.
Expand your strategy and profits!
Our specific dashboards
Finance Dashboard
Finance Dashboard
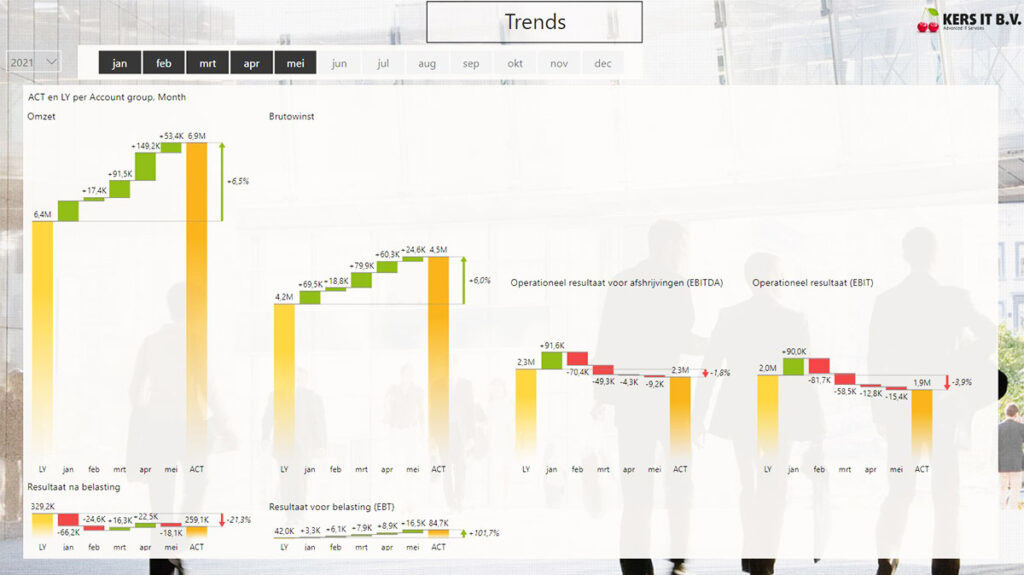
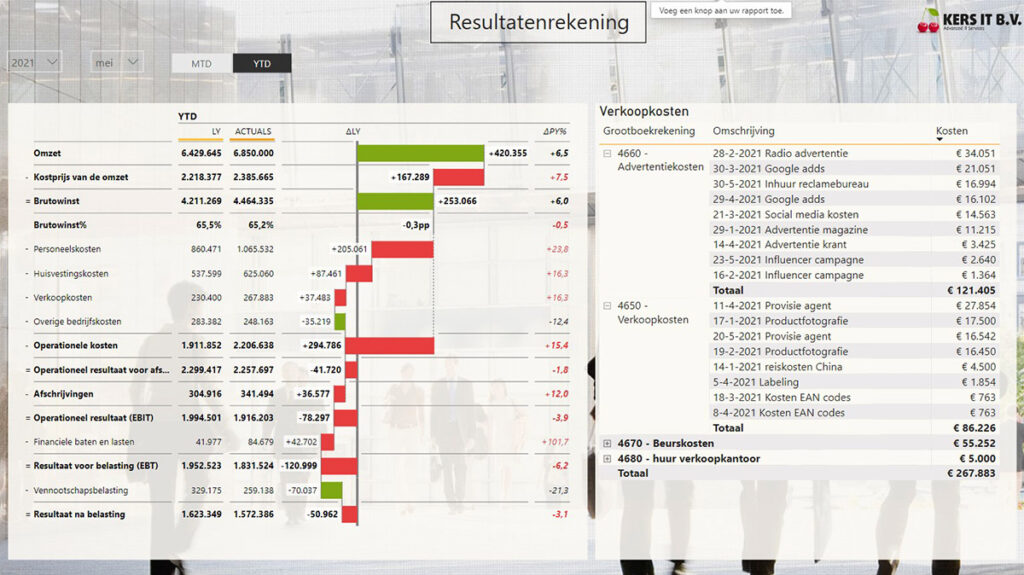
- Detailed P&L Analysis: Gain insight into profit and loss to assess financial health. Easily drill down to different cost groups or the changes in the general ledger accounts and periods and compare with previous year or your own forecast.
- Financial Statements: Produce accurate and timely financial reports for internal presentation or presentation to stakeholders.
- Cash flow insight: Monitor cash inflows and outflows to manage your liquidity situation.
- Financial Planning and Analysis Support: Leverage detailed analytics for better financial planning and risk management.
- Efficient management of monthly or period closings: Datakings BI creates reports for you based on your financial setup that help you optimize your internal control.
- Of course, we can also help you with financial insight at division level, consolidation of multiple companies within a group (provided that the necessary elimination items are available in the data), turnover analyses, gross margin analyses, accounts receivable management or accounts payable overviews.


Sales Dashboard
Sales Dashboard
- Sales Over Time: Graphical representation of sales trends over different periods.
- Sales by Product Group: Overview of sales performance based on different product categories.
- Sales by Location: Geographic breakdown of sales data, showing performance by region.
- ROI on advertising budgets: Calculate and visualize the return on investment for online advertising campaigns.
- Margin Analysis: Analysis of sales margins to assess profitability, including gross and net margins.
Production Process Dashboard
Production Process Dashboard
- Production Status: Real-time information on the progress of production orders and the availability of raw materials.
- Lead Time: The time required to complete a production order, including any waiting times and processing times at various workstations.
- Production Line Efficiency: Measurements of production line productivity and efficiency, including Overall Equipment Effectiveness (OEE) and downtime analysis.
- Quality Control: Statistics about the quality of goods produced, including defects, rejection rates, and recalls.
- Production planning: Information about planned production orders, required materials and availability of personnel and machines.
- Employee Performance: Employee performance indicators such as productivity, efficiency, and safety compliance.
- Cost Management: Overview of costs related to production, including raw materials, labor, energy, and overhead.
Management Dashboard
Management Dashboard
- Essential Business KPI Summary: See all your KPIs – no matter which system they come from – in one place
- Facilitates strategic planning and decision-making: Use accurate data to make better strategic decisions.
- Promote transparency and communication: Easily share critical insights across teams and departments to foster collaboration.
HR Dashboard
HR Dashboard
- Standard Workforce Overview: Get a clear picture of the size, composition and changes in your workforce with detailed FTE and headcount data.
- Sickness absence and absence reporting: Monitor and analyze absence trends to better manage and reduce unplanned absences.
- Recruitment & Selection: Track the progress and effectiveness of your recruitment processes with comprehensive reporting on new hires, open positions and recruitment process duration.
- Time Tracking/Project Overview Reporting: Gain insight into how employees spend their time across different projects and tasks, essential for efficiency analysis.
- Employee Turnover and Retention Analysis: Identify trends and patterns in employee turnover to improve retention strategies and increase employee satisfaction.
- Learning & Development: Track progress and participation in training and development programs to ensure your workforce has the skills and knowledge necessary to be successful.
Warehouse Dashboard
Warehouse Dashboard
- Stock Status: Real-time information about available, allocated and ordered stock levels.
- Lead time: The time it takes for a product to be manufactured from order to delivery.
- Inventory Turnover: Learn about slow-moving or obsolete inventory items, or identify your fastest-moving items and act accordingly.
- Daily Pick Performance: Statistics on daily order processing, including pick quantities per person.
- Inventory Movement History: Overview of incoming and outgoing inventory movements.
- Inventory Location Information: Details about where products are physically located in the warehouse.
- Order Fulfillment Performance: Statistics on order processing times and accuracy.
- Supplier Performance Statistics: Information about supplier performance, such as delivery time and quality.
KPI Dashboard
KPI Dashboard
- Real-time KPI tracking: Monitor progress against your key goals and KPIs in real-time.
- Custom dashboards for your specific needs: We customize each dashboard to your business needs and goals.
- Data-driven decision-making: Use reliable data to make informed decisions and optimize strategies.
- Integration with existing systems: Our KPI Dashboards work seamlessly with your current systems and processes.
- Drive growth and improvement: Identify opportunities for improvement and growth through deep insight into your KPIs.
Questions? Contact:
Rob de Monte
rob@datakings.it
+31 6 57 86 54 11
Wesley Slooven
wesley@datakings.it
+31 6 31 93 73 30
READY TO GROW?
FORM
